QRLock.US - hide content using qr codes.
I apologize to English-speaking users, but the documentation is only available in Russian so far.
Description of qrlock.us service (in Q&A mode, click on the question to get the answer).
The qrlock.us service is designed to hide content on a website from the user until they perform certain actions.
This service can partially replace the captcha service, although it is not a complete equivalent in terms of functionality.
Instead, it serves as an alternative or additional method for content concealment.
First and foremost, it is an alternative method of content protection that is still not widely used and can be employed as an alternative
or additional method to existing solutions. Secondly, this method allows users to bypass the input of any characters, which is considered
outdated (users have long been using input devices like a mouse or touchscreens, and all actions are reduced to clicks or gestures).
And thirdly, this service can potentially increase website traffic (although it's a slight increase, based on our tests, approximately 10%)
and also enhance website monetization (more on that below).
For website owners, qrlock.us requires minimal effort (making small changes to the website's code).
For users or website visitors, it requires the presence of a smartphone.
The content author on the website page (requires changes on the server-side of the website!) places specialized code.
Users are prompted to scan the received code to access the content. In the opened window on their mobile phone,
users need to press the button with the PIN code specified on the website. After that, the content will be automatically displayed to the user,
and the mobile phone will open a URL set by the content author during the creation and configuration of the qrlock.us service widget.
In our examples, a website page containing the code is opened, demonstrating the first benefit of using the service – increased traffic.
However, the content owner (or site administrator) can specify any URL for monetization or other purposes.
This URL will be opened on the user's mobile phone (which also demonstrates another "benefit" of the service – converting desktop site users into mobile users)
and will not be directly associated (although it can be linked, depending on the website owner) with the original site.
The source of traffic will be the qrlock.us service (the ability to create private landing pages will be implemented later, feel free to contact us to discuss it).
In the current implementation and examples, the following technologies were used: PHP, JavaScript, CSS, jQuery, and Twitter Bootstrap.
However, the service itself was designed to be agnostic to specific technologies. To achieve this, the service provides an API that allows it to be used with any programming language.
Currently, the service is free of charge. This will continue as long as there are sufficient server resources and maintenance expenses.
The service has a limit on the number of requests, but this limitation is not in place for monetization purposes; rather,
it helps manage peak loads if they occur. If you reach these limits, please contact us, and we will find a solution.
Yes, there is a demonstration page available.
Yes, here is an example of website traffic statistics.
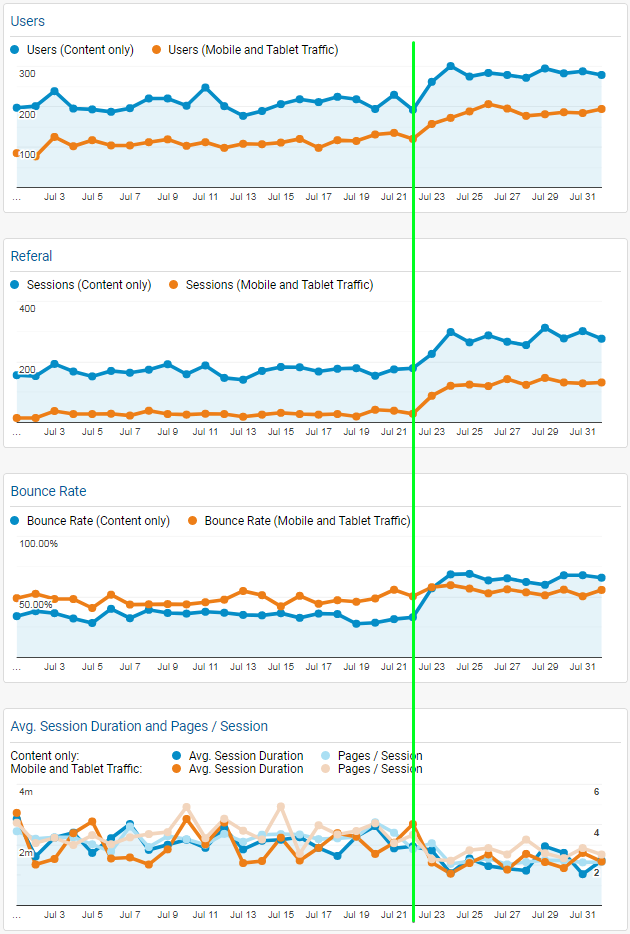
A brief explanation of the chart: This graph illustrates what happens to the website after installing the qrlock.us code. The green line indicates the start of the experiment. As seen in the graph, the following results are observed on the same day (from top to bottom on the graph):
A brief explanation of the chart: This graph illustrates what happens to the website after installing the qrlock.us code. The green line indicates the start of the experiment. As seen in the graph, the following results are observed on the same day (from top to bottom on the graph):
- There is an increase in overall website traffic and mobile website traffic. Specifically, mobile traffic increases, and overall traffic increases in conjunction with mobile traffic. Note: The traffic increase will only be achieved if the traffic is redirected back to the same website. If the traffic is directed to an external website, there will be no changes in the traffic statistics on the website. This is not analogous to pop-up windows, pop-under windows, or other explicit interventions in the quality structure of traffic.
- The percentage of referral traffic significantly increases (again, only if the traffic is redirected back to the website).
- The bounce rate increases. Yes, this is a negative impact, but it should be noted that in this experiment, we did not attempt to engage with "new" traffic. We simply opened the same URL on a mobile device, which was not of interest to our users. If the traffic is directed to a different location or if attempts are made to offer something useful to the user (specifically for mobile devices), the bounce rate may not decrease significantly.
- Lastly, the "time on site" decreases, which is also not ideal, but it is the same situation and explanation as with the bounce rate.
Please refer to the developer documentation (only Russian, sorry) for more information.
QRMark.NET, a QR code generation service.
Please refer to the contact information on the contacts page.